Sunday, May 21, 2017

Final Project: Site Selection

Dave and Buster’s Site Selection
Introduction:
The purpose of this report is to analyze potential sites for a new Dave and Buster's restaurant franchise in the Madison, Wisconsin metropolitan area. Using ESRI Business Analyst software this report will analyze potential store locations in terms of
·         Location of Competitors
·         Ideal Customers
·         Drive Time Trade Areas
·         Optimal Store Locations
·         Gravity Model/ Point of Indifference
The data source for each analysis is ESRI 2016 business analyst data.
Background:
  Dave and Buster’s is an American Restaurant/ Entertainment business that began operations in 1982 and is headquartered in Dallas, Texas. The business specializes in American cuisine such as burgers, steak, chicken and seafood. Each location includes an extensive onsite video arcade and full bar service. It has often been informally described as “Chuck E. Cheese for adults”. As of February 27th, 2017 the company operates 94 stores in the United States and Canada


Market Requirements:
Dave and Buster's prefers their franchises to be located in sites with a daytime population of between 700,000 and 1,000,000 individuals within a ten mile radius. The preferred location would be between 26,500 and 40,000 square feet with seating room for up to 200 and between 300 and 400 parking spaces which may be shared with another business.


Study Area:
  The study area for this analysis is the Madison, Wisconsin metropolitan area. This area has a metro population of 641,385. This falls short of the company's preferences, however the presence of a prominent division one university in the area would likely increase profits to desired numbers. There is currently only one other Dave and Buster’s in the state of Wisconsin located outside of Milwaukee.
_______________________________________________________________


Methods


  1. Customer prospecting
The first part of the site analysis process is to locate potential customers. The demographic that would be likely to visit a Dave and Buster’s franchise would be individuals between the ages of 25 and 30 who have disposable income and are familiar with electronic games. This type of demographic is fairly easy to reach in a college town. Using ESRI Business Analyst customer prospecting analysis a map was created showing where potential customers who fit this demographic would be located in the Madison, Wisconsin study area. The parameters used for the analysis include individuals between the ages of and 25-30, individuals who visited a bar or nightclub within the past 12 months and individuals who have played video games within the past 12 months. The 25-30 year old demographic was selected because individuals in this demographic are likely recent college graduates who have more disposable income.Customer_prospect.JPG
Figure 1: Locations of potential customers within the study area.


The results of the analysis indicated that the most likely locations for potential customers are in the suburbs surrounding the city rather than in the center of the city itself.
_______________________________________________________________________


II. Locations of competitors


The second factor to consider when selecting a site for a business is the location of any potential competitors. There are not many franchises  that follow the Dave and Buster’s business model if combining an Entertainment center with a full service bar and restaurant. The direct competitors would be other restaurants that cater to a similar demographic. The best example of this would be a restaurant similar to Buffalo Wild Wings. Using ESRI Business Analyst, several competitors were located within the study area based on certain search criteria. Among these criteria were chain restaurants that had 50 or more employees. In terms of geography and the study area, the majority of these restaurants were located in close vicinity of Madison’s two malls. Notable competitors include Buffalo Wild Wings and Applebees. Another potential competitor would be Chuck E. Cheese’s, however this business caters to a much younger demographic and would likely not draw away too much business.
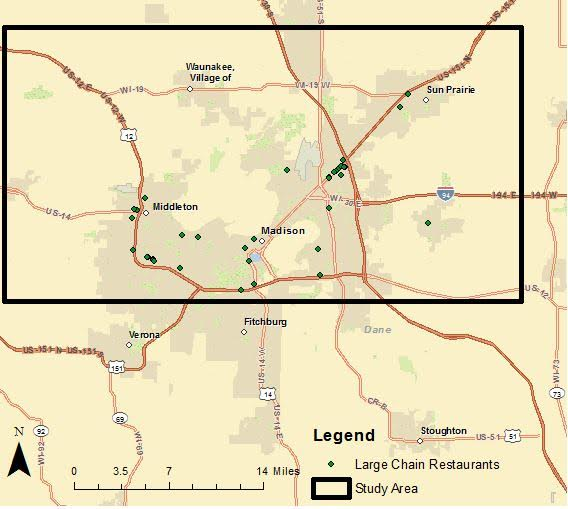
Figure 2. Locations of competitors within the study area.

III. Optimal Store Locations


Using the “Find Similar Sites” analysis tool in ESRI Business analyst, three potential store locations were found. The analysis was performed based on the locations of other larger restaurant chains within the study area. According to the analysis, the best locations to build a restaurant franchise in the Madison area within a half-mile radius of either the East or West Towne malls. Three potential locations were ranked in order of most to least ideal. These include


  1. 430 S. Gammon Rd. 53719
  2. 2001 Zeier Rd. 53704
  3. 4802 Amcenter Dr. 53718


Each of these locations would be ideal due to their close proximity to a highway or major road as well as being located close to several prominent businesses that could potentially draw in customers. Additionally, the sites could utilize nearby mall parking as some of the 300-400 required parking spaces, as is allowed in the Dave and Buster's market requirements.


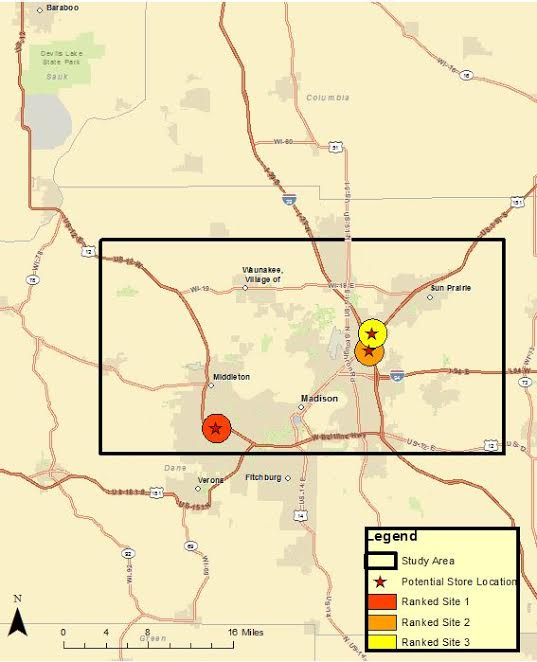
Figure 3: Locations of Potential Stores


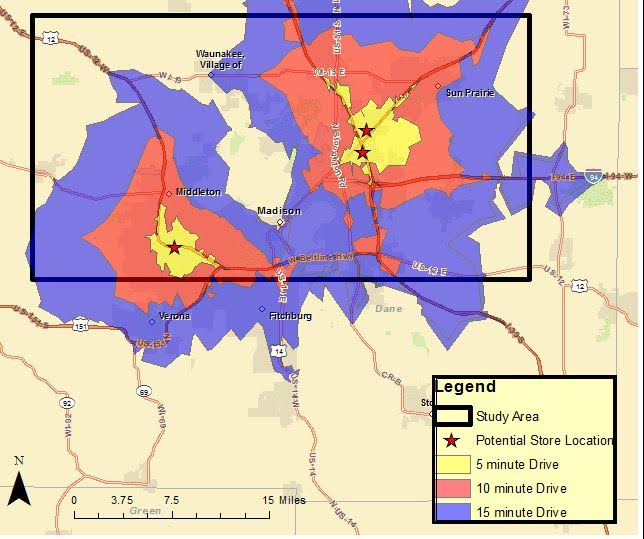
IV. Drive Time Analysis.


In order to narrow down which location would be best, a drive time trade area was established around each potential location. These trade areas divide drive times into 5, 10 and 15 minute segments showing how long potential customers would need to drive to reach that store location. The majority of the study area is within a 15 minute drive of each proposed locations. The location on Gammon Rd, however, is in a slightly better location as it has a shorter drive time to downtown Madison and the UW-Madison campus than the other two locations.
______________________________________________________________________
Figure IV: Drive Time Trade Areas


V. Gravity Model/Point of Indifference


Related to drive time is the concept the point of indifference. This represents the furthest point that customers would be willing to travel to visit a site that was between two cities. The Dave and Busters franchising website states that customers on average are willing to travel 20 minutes to reach their stores. A more accurate point of indifference may be calculated using Reilly’s Law of Retail Gravitation, or more simply the gravity model. The formula for the model is seen below.
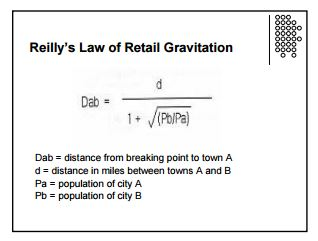
Figure V: Gravity Model Formula


For this analysis the point of indifference has been calculated for three communities close to Madison, WI. They are as follow


  1. Middleton, WI (2010 Pop. 17,442) Point of indifference= 6.3 miles


     2. Sun Prairie, WI (2010 Pop. 31,752) Point of indifference = 18.48 miles


     3. Verona, WI (2010 Pop. 10,619) Point of indifference = 11.4 miles
______________________________________________________________________
Conclusions
It has been concluded that the best site to locate a Dave and Buster’s franchise within the Vicinity of Madison, Wisconsin would be at 430 S. Gammon Rd. 53719. The reason for this decision are as follows

1.Based on the customer prospecting analysis, this site is centrally located between several areas that contain customers who fit the target demographic of the business.
               
2. Based on the location of competing stores, they are very few businesses in the area that would be considered direct competition. The only store that would be considered a competitor would not likely draw away business as they cater to a much younger demographic.


3. This site was the topped ranked prospective site in the site ranking analysis.


4. Based on the drive time analysis, this site is within a reasonable drive time of several suburbs as well as the University of Wisconsin campus which would be a larger source of potential customers.


5. Based on the gravity model, this site is within the point of indifference of two major suburbs that are included in the prospective customer analysis.


Based on the above criteria, the geographically advantageous location close to a mall and major highway, and the larger number of nearby individuals who fit the company's target demographic, I believe that 430 S. Gammon Rd, Madison, WI 53719 would be the best site for a new Dave and Buster’s franchise.


Sources:
2016 ESRI Business Analyst Data
Dave and Buster’s franchise requirements webpage

Tuesday, April 25, 2017

Trader Joes Site Selection

Table of Contents.
I.                     Introduction
II.                   Market Penetration
III.                 Optimal store locations/Mean Centers
IV.                Ideal Customers
V.                  Site Ranking
VI.                Conclusion

I. Introduction
                Purpose:  
The purpose of this report is to summarize the site selection process for a new Trader Joes store in the Minneapolis/ St. Paul area which would allow the company to build a new location that would maximize potential profits.
                Methods:  The site selection was determined with analyses performed using E.S.R.I Business Analyst software.  The analyses that were performed include a market penetration report, a mean center calculation, an analysis of ideal customer locations and a ranking of the purposed sites

II.                   Market penetration

A market penetration analysis was done to determine where the Trader Joes Company is best able to penetrate their market within the Minneapolis/St. Paul area. It was determined that the company is best able to reach their target market in the cities directly surrounding the Minneapolis and St. Paul, and less so in the further outlying towns. The results can be seen on the map below. A darker color and higher decimal value on the legend indicates better ability to penetrate the target market.

Figure 1. Market Penetration.


III.                 Optimal locations/ Mean centers

The Purpose of this analysis was to determine three optimal locations for a potential trader Joe’s store. This was done using the site analysis tool in the ESRI business Analyst software. The analysis was performed within a study area that included Hennepin and Ramsey counties. The software then calculated the three areas within this study area were customers were centralized. This was calculated using customer location data. It was determined that the three mean centers were outside of the cities of Roseville, Edina and Maple Grove. This is further illustrated below in figure 2.


 Figure 2. 
Optimal Store Locations

IV.                Ideal Costumers.

Using the market analysis tool in Business Analyst, a report of locations for potential customers was generated. The report shows the locations of potential customers based on certain criteria. The criteria used in the analysis included customers between the ages of 30 and 39 years of age with a median annual income of $55,000 or higher and individuals who have purchased organic food within the past 12 months. The results can be seen below in figure 3. The green shaded areas represent regions with customers who fit the above criteria. The majority of these customers are located within the suburbs directly adjacent to the twin cities, more so around St. Paul

Figure 3.
Prospective Customers.


V.                  Site ranking

Using the site analysis tool, the three selected mean centers were ranked in terms of how well the met certain criteria. The criteria included population, household income and individuals who had shopped at Trader Joes locations within the past six months. The site closet to Roseville was ranked number 1, the site closest to Maple Grove was ranked second and the site closet to Edina was ranked third. Using this information, three locations within the surrounding area of the ranked sites were chosen as potential locations for a new store. Each of these sites are located within close proximity of a retail center, such as a shopping district or mall. The locations of these sites may be seen below in figure 4.


Figure 4. Site ranking and purposed locations


VI.                Conclusion


Based on the information that was obtained in the analyses, it was determined that the site located at 10 Rosedale Shopping Center in Roseville would be the ideal location for a new Trader Joes store. Based on the market penetration report this site is well within the ideal range for penetrated the target market. It is also located very close to one of the three determined mean centers. Based on the prospective customer report, this site is centrally located within a large area of potential customers who fit the desired criteria. Finally, this location is within close proximity of the highest ranked potential site yet is far enough away from existing Trader Joes locations that it will not be stealing potential business. I believe that this location would be the best choice for the company to build a new store in order to maximize their potential profits. 

Tuesday, April 4, 2017

Real Estate Analysis

Introduction
Throughout this Real Estate Analysis project, a currently listed house has been given as an example of what selling a home for a reasonable price entails. The report aims to connect a home located in the Third Ward historic district of Eau Claire, WI with a likely purchaser, while also using various resources to explore the housing market. Pictures and data listed below come from Zillow.com and FindtheHome.com. This report will highlight the following:


  • Key features of the home
  • Geographical location with respect to neighboring homes
  • Housing stock
  • Future expansion of the town
  • Suggestions for improvements to the home to increase the market value
  • Comparison to adjacent homes


210 Gilbert Avenue

house 1.png

dining rooom.pngKey Features
5 beds
1 full bath, 1 half bath
1,908 sq. ft.
Built in 1913
Lot: 4,369 sq. ft.


Fun Features
Flooring: Hardwood, Carpet, Tile
Wood burning fireplace
Abundance of windows increase natural light
2 Story Home
house 2.pngFormal dining room
Detached garage, 1 space
Patio deck: 3-season room, enclosed porch
Fenced yard
Full basement
Vinyl siding
HVAC
hall way.png


Location
Eau Claire is filled with a mixture of rich, historical neighborhoods, off-campus student housing and young families. There is an abundance of parks, trails, rivers, and bridges, coining Eau Claire as “the City of Bridges.” The charm from the Third Ward and downtown gives off a warm sense of home. Figure 1 color coordinates the distinction between named areas.
map 1.png


Figure 1. Map of Eau Claire, WI, illustrating the different neighborhoods.
Source: Eau Claire Comprehensive Plan 2015


Built in 1913, this home is located in the Third Ward district of Eau Claire. Outlined in figure 2 below, you can see the position of the home, not far from the Chippewa River and Owen Park. The historical location is situated between the college campus of University of Wisconsin- Eau Claire and downtown Eau Claire. The Third Ward is a neighborhood unlike others in the area due to the large number of registered historic homes. Offering a wide range of architectural design from Colonial Revival to Queen Anne, it is sure to impress anyone passing by. The accessibility to the Water Street district and downtown appeals to many.
Figure 2. Map of Eau Claire, WI specifically highlighting the Third Ward district and part of downtown Eau Claire. 210 Gilbert Avenue is shown within the neighborhood’s limits.
Source: Thirdward.org


Suggestions for home improvements


In order to increase the value of the house itself, a couple of home improvements could be made. Listed below are recommendations on what particularly would help in increasing the worth.


  • Adding a master bathroom with all the works
  • Adding another full bath or renovating the half bath to a full
  • Add low maintenance landscaping to boost curb appeal
  • Add skylights or solar panels to cut energy cost
  • Minor kitchen upgrade


Housing Stock

Figure 3. Housing Stock percentage based on Census Tract and Year Built
Source: 2015 Eau Claire Comprehensive Plan


The third ward is one of the oldest sections of the city of Eau Claire. As seen in figure 4, tract 17, which includes the third ward, has the smallest number of homes built between 1970 and 2012. For this reason, many of the homes in this area have a higher than average market value. This higher market value is also an indication of the structural state of the homes compared to some of the more weathered older homes in the Randal park neighborhood.


Figure 4.: Third Ward Community Profile
Source: Esri Business Analyst desktop


Based on a community profile report generated using ESRI Business Analyst software, the Third Ward has a high renter occupancy rate at 58.7%. Although not as high as tracts 11.01 and 12, which consist of the larger areas of student housing in the Randal Park neighborhood, this percentage is still higher than average. This is further illustrated in figure 5. This can be attributed to its close location to the University of Wisconsin-Eau Claire campus.
Figure 5: Percent of renter occupied housing
Source: 2015 City of Eau Claire Comprehensive Plan


The higher than average number of renters may not appeal to individuals looking to avoid certain aspects of student life such as loud parties. However, as can be seen in figure 6, the majority of the renter occupied housing in the third ward is located in the northern section closer to downtown
.


Figure 6: Third Ward Land Use

Source: Eau Claire 2015 Comprehensive Plan


Future Development:


The city of Eau Claire is currently undergoing several major developments and the home at 210 Gilbert is situated close to many of these. One noteworthy development that has recently gone underway is the Garfield Avenue project on the University of Wisconsin-Eau Claire campus. Located less than a mile from the house site, the project will include several green spaces, riverfront seating and an outdoor amphitheatre. Expected to be completed in the fall of 2018, the site will be an ideal outdoor recreation location.
SiteVisit05-WaterfrontPlanLG.jpg

Figure 7: Garfield Ave Site Plan
Source: University of Wisconsin-Eau Claire


Another ongoing development that is slightly further away yet still within easy access is the Eau Claire Confluence center. Located downtown at the intersection of the Eau Claire and Chippewa rivers, the site will expand upon the student housing building Haymarket Landing that was opened in the fall of 2016. The future site will include a brand new fine arts center as well as an outdoor riverfront plaza. 17_0213-haymarket-plaza-final-mp-moda-sm.jpg


Figure 8: Confluence Final Plan
Source: Community for the Confluence


With 210 Gilbert street being located centrally between both of these developments, it will be a highly valuable property in the coming years. Based on the report from figure 4, the median home value for houses in the third ward district in 2021 is estimated to be just over $243,500. Following the completion of these developments, that value is likely to increase.
      
Demographics
           The property of 210 Gilbert is located in the Third Ward, which has a population of 3455 people, according to findthehome.com. This means that 5% of the population of 67545 in Eau Claire currently reside in the Third Ward. Of those 3455 people residing there, only 40 % of the occupants are owners of the property. This is because of the large number of college aged students who reside in the Third Ward (39%) because of its relative location to the University. However the second largest age group is people under the age of 20. Some of these residents may be 19 year old college students living off campus, however it is unlikely to change the number all that much. With this being said it is likely that there are a large amount of children living with their parents in the Third Ward, suggesting that it is a suitable location for a nuclear family.
Figure 9 : Age in the Third Ward, Eau Claire, and the U.S.
Source: findthehome.com
           
The Third Ward is mostly low income, with 42.9% of the population making an annual income of less than $25000 a year. This comes from the aforementioned fact that the majority of the occupants are college aged, and most likely bring home a small amount of money due to being students. While the area is defined as being low income it should be noted that it is a well-educated community, with 33.9% of the population over the age of 25 attaining a bachelor degree, as seen on the figure below. With its proximity to the University of Wisconsin- Eau Claire there is a large amount of residents who are also attaining an education.
           
Figure 10 : Annual household income in the Third War, Eau Claire, and the U.S.
Source: findthehome.com
The Third Ward is predominantly Caucasian, with 94% of the population identifying as such. While the city of Eau Claire does have a prominent Hmong community there are less people identifying as such than in the city of Eau Claire as a whole. The language spoken at 92% of the homes is English, chiefly from the large Caucasian presence.
Figure 11 : Ethnicity in the Third Ward, Eau Claire, and the U.S.
Source: findthehome.com
The Third Ward is a bustling area with a large amount of students walking to class on an average day. While most of the commuters in the Third Ward decide to drive, it should be noted that there is a larger portion of people walking and biking than is typical in the US, or in Eau Claire. This is easily seen on an average day with many college students traveling through the neighborhood to the University.
Figure 12 : Commute methods in the Third Ward, Eau Claire and the U.S.
Source: findthehome.com
Similar Real Estate in the Area


           Looking at recent sales in the Third Ward of Similar houses, with similar size, bedrooms, and bathrooms. We can see a certain trend occurring. Looking at 1622 Frederic, 510 Gilbert, and 330 Lincoln. All of these are 4 bedroom 2 Bathroom estates, of larger square footage than 210 Gilbert. Although 210 Gilbert is 5 bedroom, its 5th bedroom may be considered for different use because of a lack of space.
           Of these recently sold estates two were sold for just under 200,000. Both of these houses are larger, with larger lots, and built before 210 Gilbert. Using this information it may be assumed that Zillow is overestimating the actual selling price that 210 Gilbert may be purchased for. Because of this it is important to look at similar houses in the area, and what they’re asking prices are, before moving forward with purchasing 210 Gilbert.
Figure 13 : Compared to houses sold in the last year
           Now looking at real estate being sold now we have 3 similar houses. 330 Roosevelt, 1710 State, and 446 McKinley are all listed near the same asking price and are similar in square foot. As we see here there is a lot of disparity in the size of the lot, this seems to be a large factor in these houses today, as they are all comparable. 210 Gilbert has a small lot size compared to other similar houses being sold in the area. There are other options in the area which offer larger lot sizes and similar accommodations. When selecting a residence the determining factor of 210 Gilbert may be the aesthetic which it has, as it is a well-kept house. However the colonials in the area are selling for similar prices and seem to be in similar if not better shape, and are newer.


Figure 14 : Compared to houses on the market
Conclusion


We have determined that Zillow is overestimating the price and the lot size is smaller than other comparable homes, therefore we reduced it by approximately $10,000.

Suggested Sale Price : $188,000