Study Areas, Customers and Trade Areas and Geocoding
Introduction:
The purpose of this report is to provide two
businessmen in San Francisco who own similar businesses with information that
will allow them to maximize trade areas without competing against each other.
For the purpose of this report, the store in the northern section of the city
will be referred to as store 1 and the store in the south will be store 2. The
customers have provided customer data which has been analyzed using ESRI
Business Analyst GIS software. The results of this analysis have been displayed
through four maps depicting the locations of both stores and their customers,
the customer derived trade area for each store, the walk/drive time for each
customer and the location of competitors. Each of these maps will be individually
explained in further detail.
I.
Customer
Location
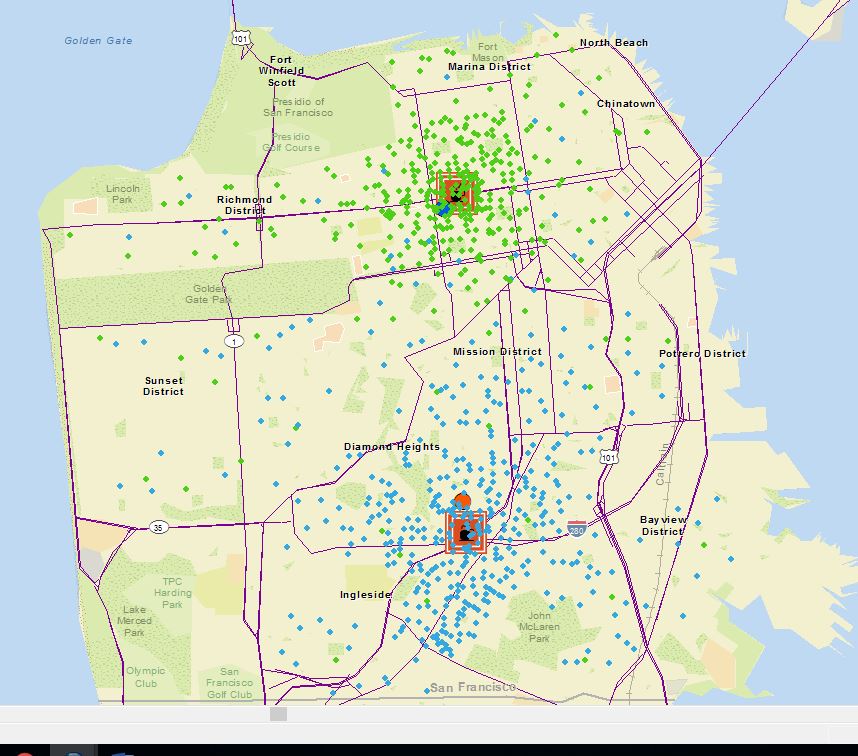
This map displays the location of customers for both
stores as well as the mean centers where the largest concentrations of
customers exist. The two coffee shops are represented by the coffee cup symbol
with the customers being represented by the small colored dots and the mean
centers by the large singular circles located near each store. Store 1 has
customers represented in green. Store 2 has customers represented in blue. Both
stores have a strong customer base in their immediate vicinity with not much
customer overlap. The location with the greatest potential for customer overlap
would be in the Mission District, which is centrally located between the two stores.
Given this information, it would not be recommended that the stores attempt to
expand their customer base in this area as it would create the potential for
competition.
II.
Customer Derived Trade Areas

This
map displays the current trade areas based on customer location. The yellow,
orange and blue rings represent where forty, sixty and eighty percent of
customers are located. According to data obtained from a generated business
analyst report, the customers within the derived trade area for store 1 spent
on average $991.39 on bakery and cereal products, items typically sold in
coffee shops. Customers for store 2 on average spent $1024.49. Based on this
information, it can be inferred that customers at store 2 are likely to spend
more money on these products than customers in store 1. Additionally, store 2
has a larger trade area, which is partially contributed to the geography of the
city, as store 1 does not have room to expand to the north without either
running into a park or body of water.
III.
Competitors

This
map displays the locations of competitors in relation to both stores. As can be
seen, there is a large concentration of competitors in the northeast section of
the city, part of which lies in the trade area for store 1. As a result, it
will be more difficult for this store to draw in new costumers as they need to
compete with other locations for business. Many of these stores are chains such
as Starbucks, so store 1 may pull in more customers who are looking to support
local small business. Also, the majority of store 1’s customers reside outside
of this area of competition, which would be a benefit to the store. Store 2 is
much more fortunate in that the majority of its competitors are outside of the
immediate trade area. As a result this location will likely draw in more customers and
have larger profits.
IV. Drive
Time

This is a map indicating
how far customers need to travel in order to reach the store. The yellow,
orange and blue rings represent .5, 1 and 1.5 miles respectively. As can be
seen in the map, store 1 is in a more ideal location as the majority of its
customers need to walk one mile or less to reach the store. As for store number
2, there are a large number of customers who need to walk more than 1.5 miles
to reach the store. That fact that the customers are willing to travel this
distance may be a testament to the quality of the product, however this
location needs to take caution to prevent losing customers to competitors who
take less time reach.
Conclusion:
These four maps provide
costumer information that will benefit both stores and allow them to maximize
their trade areas. Store 1 is in a more ideal location as its customers need to
travel a shorter distance to reach the store. The customers for store number 2 need to
travel further, however they are likely to spend more on products typically
sold in coffee shops. Both stores have competitors in their trade areas,
however store 1 is much more likely to experience competition due to the high
concentration of rival stores. Store number 2 is in a more ideal location in terms
of potentially expanding its trade area as store 1 is more geographically
limited for expansion. The stores are in
good locations to prevent competing for customers, however there is potential
for customer overlap in the Mission district area.
No comments:
Post a Comment